

MES System
Intelligent MES System Boosting Glass Factory Production EfficiencyOur MES platform optimizes sales scheduling, production execution and data analytics for glass processing factories. Equipped with graphical navigation and mobile APP access, it enables unified control over orders, production workflows and inventory, delivering real-time data to facilitate data-driven decision making.
How Does MES System Optimize Your Manufacturing Workflow?
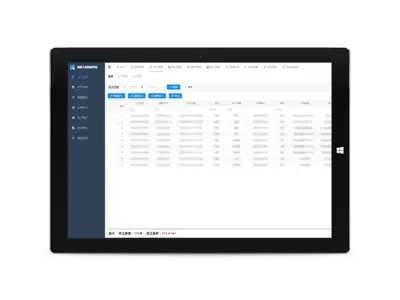
The MES System is a comprehensive solution that revolutionizes manufacturing operations by integrating sales management, production tracking, and statistical analysis. Its graphical navigation interface allows for quick order processing, including order entry, review, and delivery management. The system also supports the creation of process cards (sub-racks) based on customer requirements, which can be optimized and printed for production.
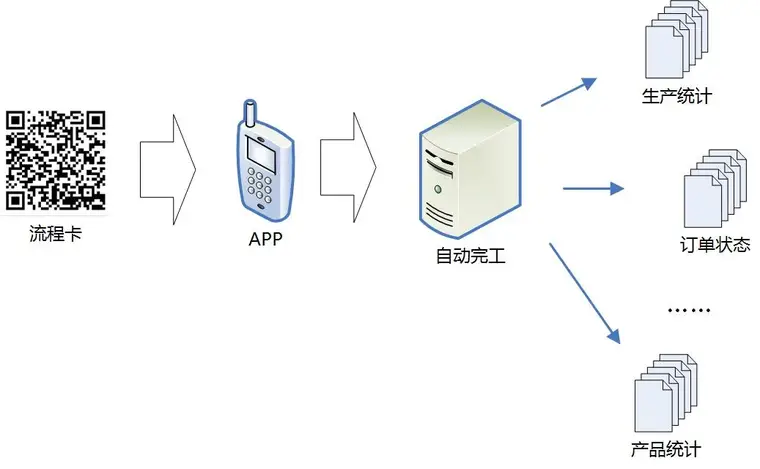
Production management is simplified with the MES System's mobile app, enabling production staff to scan QR codes on process cards with smartphones, automatically updating the completion status. This reduces manual operations and minimizes errors.
Statistical management within the MES System provides a suite of tools to visualize order volumes, production progress, and inventory levels. Customizable reports can be generated to meet specific business needs, offering valuable insights for strategic planning.
- Real-time data tracking for immediate business insights
- Mobile app integration for efficient production updates
- Comprehensive statistical analysis for informed decision-making
Key Features of MES System
1. Sales management
The system adopts a graphical navigation interface, and the client can quickly complete operations such as order receiving, production scheduling, delivery, and payment collection in daily trade management without installation.
Orders
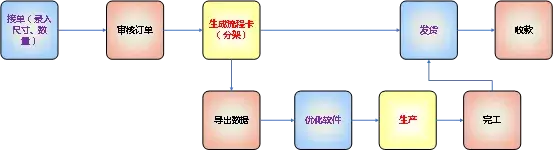
The order taker enters or imports information such as size, quantity, product and processing requirements into the system.
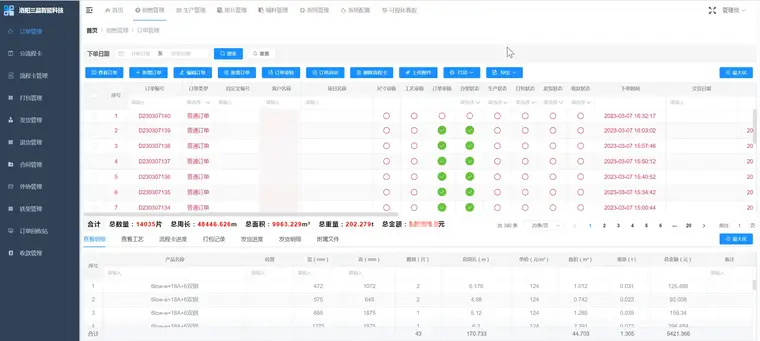
(1) Order review. The order reviewer reviews the order to prevent errors due to human factors during the entry process. After the review is completed, the sales order can be printed/exported and submitted to the customer for confirmation.
(2) Subracks. According to the customer, product type, processing technology and other factors, the process card (sub-rack) is divided. After the sub-rack is completed, the data can be exported to the optimization typesetting software for typesetting optimization, and the process card is printed to enter the production process.
(3) Shipping. Print the invoice, including delivery details, amount and other information.
(4) Collection. Add, edit, and review the details of each payment.
(5) Completion (by hand). Enter the completion status of each production process according to the process card (optional).
2. Production management
With the self-developed mobile application (APP), it can replace the manual completion operation. After the production personnel complete the production, they can use smart devices such as mobile phones to scan the QR code on the process card to automatically complete the completion operation.
3. Statistics management
The system is equipped with a variety of convenient and practical statistical functions, which can help managers understand the status of orders, production, delivery, collection, customers and inventory in real time, and provide data support for subsequent decision-making.
(1) Order statistics. Display the order volume, review volume, shelf quantity, etc. in chart form.
(2) Order statistics. Customer order status (area, amount) in chart form.
(3) Progress statistics. Take order/customer as the dimension to count the completion status of the process.
(4) Production statistics. Display the completion data and reported loss quantity of each process in chart form.
(5) Shipping statistics. Display the delivery area and delivery amount in chart form.
(6) Collection statistics. A graph showing the amount collected each day over time.
(7) Product statistics. Display the quantity and area of various products over a period of time in chart form.
(8) Type statistics. Graphically displays the number and area of monolithic types over a period of time.
(9) Inventory statistics. Display raw film/excipient inventory status in chart form.
(10) Report. Customize production weekly, monthly, annual reports, etc. according to user needs.